New construction starts in June decreased 7% from the previous month to a seasonally adjusted annual rate of $595.1 billion, according to Dodge Data & Analytics.
The nonbuilding construction sector (public works and electric utilities) fell sharply after being lifted in May by the start of a $3.8-billion oil pipeline in the upper Midwest and seven large powerplant projects totaling $4.3 billion. Residential building in June edged down, with reduced activity reported for both single-family and multifamily housing.
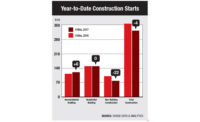
At the same time, nonresidential building registered moderate growth in June after sliding back in April and May. Through the first six months of 2016, total construction starts on an unadjusted basis were $318.1 billion, down 11% from the same period a year ago.
The January-June period of 2015 included 13 exceptionally large projects valued each at $1 billion or more, including a $9.0-billion liquefied natural gas export terminal in Texas, an $8.5-billion petrochemical plant in Louisiana and two massive office towers in New York City—the $2.5-billion 30 Hudson Yards and the $1.2-billion One Manhattan West.
In contrast, the January-June period of 2016 included only four projects valued at $1 billion or more. If these exceptionally large projects are excluded, total construction starts during the first half of 2016 would be down a slight 2% from last year.
June’s data lowered the Dodge Index to 126 (2000=100), compared to 135 in May. After strengthening in this year’s first quarter, the Dodge Index fluctuated in the second quarter, rebounding in May after April’s decline, followed by another decline in June.
“The construction start statistics on a monthly basis continue to show an up-and-down pattern,” said Robert A. Murray, chief economist for Dodge Data & Analytics. “This has often been due to the presence or absence of very large projects for a given month, which most recently applies to the May and June behavior for public works and electric utilities,” he said.
“Over a broader timeframe, the year-to-date comparisons during the first half of 2016 were skewed by a number of exceptionally large projects (defined as projects valued at $1 billion or more) that reached the construction start stage in last year’s first half,” Murray said. “There were fewer such projects during the second half of 2015, which should help the year-to-date comparisons as 2016 proceeds.
“In addition, last year’s third quarter witnessed a broader slowdown for construction starts, as investment grew more cautious due to mounting concerns about the global economy and the continued drop in energy prices at that time,” Murray said.
“The generally weaker third quarter of 2015 will also help the year-to-date comparisons for construction starts as 2016 proceeds. While investment remains cautious, some uncertainty has been alleviated, with energy prices stabilizing during this year’s first half.
“In addition, the anxiety created in late June by Great Britain’s vote to leave the European Union has eased, as shown by the recent rebound in stock prices. There continue to be several supportive factors worth noting for construction activity this year—long-term interest rates have moved lower, commercial development is being financed by multiple sources, construction bond measures are providing funding for institutional building and public works projects, and the multiyear federal transportation bill is in place,” Murray said.
Nonbuilding Construction
Nonbuilding construction in June plummeted 24% to $145.7 billion (annual rate), reversing the 24% jump that had been reported in May. The public works categories as a group fell 27% in June, pulled down by a 65% plunge for miscellaneous public works, which includes oil and natural gas pipelines.
The miscellaneous public works category in May was lifted by the start of the $3.8-billion Dakota Access Pipeline, which will connect the Bakken and Three Forks oil production areas in North Dakota to existing pipelines in Illinois.
While miscellaneous public works did include several large projects as June starts, such as a $140-million rail extension project in Denver, they were not the same magnitude as the Dakota Access Pipeline reported for May. Sewer construction and water supply systems also registered declines in June, falling 13% and 29% respectively.
River/harbor development posted a 13% gain in June, strengthening for the second month in a row after a weak April. Highway and bridge construction in June edged up 2%, lifted by a $600-million segment of the $1.5-billion Project Neon freeway expansion in Las Vegas.
Through the first six months of 2016, the top five states ranked by the dollar amount of highway and bridge construction starts were Texas, California, North Carolina, Florida and Illinois. States ranked six through 10 during this period were New York, Pennsylvania, Ohio, Nevada and Virginia.
The electric utility and gas plant category in June fell 18% following its 57% increase in May. June included the start of three large natural-gas fired power plants located in Tennessee ($975 million), New York ($900 million), and New Jersey ($600 million), as well as a large wind farm in Iowa ($900 million). While substantial, the sum of these four large power-related projects at $3.4 billion was less than the $4.3 billion for seven large power-related projects in May.
Residential Building
Residential building, at $268.6 billion (annual rate) slipped 2% in June, with slightly diminished activity for both single-family and multifamily housing relative to May. Single-family housing in June settled back 1%, which essentially maintains the plateau that’s been present in the first half of 2016 after the improved activity registered during the closing months of 2015.
The first half of 2016 showed this regional pattern for the dollar amount of single-family construction compared to last year—the Midwest, up 14%; the Northeast, up 9%; the South Atlantic and West, each up 8%; and the South Central, up 3%.
Multifamily housing in June retreated 5% after climbing 16% in May. There were 10 multifamily projects, each valued at $100 million or more, that reached groundbreaking in June, led by the $493-million multifamily portion of the $600-million Century Plaza mixed-use development in Century City Calif.; two apartment towers in Brooklyn, N.Y., valued at $228 million and $181 million respectively; and a $170-million apartment tower in Jersey City, N.J.
Through the first six months of 2016, New York City continued to be the leading metropolitan area in terms of the dollar amount of multifamily starts, followed by Los Angeles, Miami, Chicago and Boston. Metropolitan areas ranked six through 10 during this period were Washington, D.C., San Francisco, Dallas-Ft. Worth, Atlanta and Denver.
Of these 10 metropolitan areas, seven showed greater activity compared to a year ago, while three showed declines—New York City, down 27%; Washington, D.C., down 18%; and Denver, down 2%.
Nonresidential Building
Nonresidential building in June grew 6% to $180.8 billion (annual rate), strengthening after its April and May declines. The commercial categories as a group rose 9% in June, with the upward push coming from hotels and office buildings.
Hotel construction advanced 36% after a weak May, boosted by a $128-million Marriott hotel in Nashville, the $106-million hotel portion of a $230-million mixed-use development in Washington, D.C., and a $100-million convention center hotel in Des Moines.
Office construction increased 19% in June, led by four large projects—a $172-million addition to the Fannie Mae headquarters in Washington, D.C.; a $150-million renovation of Nova Place in Pittsburgh; a $150-million addition to a U.S. Army building at Fort Belvoir, Va.; and a $120-million office building in Washington, D.C.
During the first six months of 2016, the top five metropolitan areas in terms of the dollar amount of office starts were New York City, Washington, D.C., Dallas-Fort Worth, San Francisco and Atlanta. Metropolitan areas ranked six through 10 during this period were Boston; Los Angeles; Seattle; Reno, Nev.; and Chicago.
Stores and warehouses both retreated in June, sliding 4% and 17% respectively. The manufacturing plant category weakened further in June, falling 29%.
The institutional side of the nonresidential building market increased 7% in June, reflecting a mixed pattern by project type. Health care facilities climbed 22%, boosted by three large hospital addition projects, located in Toledo, Ohio ($350 million); Bryn Mawr, Pa. ($150 million); and the Fayetteville, Ark. area ($127 million).
Educational facilities edged up 1% from May’s pace, helped by such projects as the $213-million renovation of the Cincinnati Museum Center at Union Terminal; a $98-million high school in Pittsfield, Mass.; and a $92-million training center for Southwest Airlines in Dallas.
The relatively small transportation terminal category jumped 95% from a weak May and included a $78-million train station renovation in Queens, N.Y.
Losing momentum in June were public buildings (courthouses and detention facilities), down 4%; churches, down 18%; and amusement-related projects, down 23%.
The 11% drop for total construction starts on an unadjusted basis during the January-June period of 2016 reflected reduced activity for both nonbuilding construction and nonresidential building, relative to their elevated pace of a year ago.
Nonbuilding construction fell 22% year-to-date, with public works down 15% and electric utilities/gas plants down 33%. Nonresidential building fell 19% year-to-date, with commercial building down 7%, institutional building down 12% and manufacturing building down 70%.
Residential building continues to be the one major sector that’s advancing year-to-date, rising 4%, with an 8% gain for single-family housing outweighing a 4% decline for multifamily housing.
By geography, total construction starts during the first six months of 2016 showed this pattern compared to last year—the South Central, down 32%; the Northeast, down 11%; the West, down 3%; the South Atlantic, down 1%; and the Midwest, up 5%.


