 |
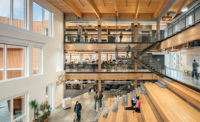
The construction forecast from industry management consultant FMI Corp., Denver, predicts that the office building market will be one of the industrys fastest growing sectors in 2005. FMI expects office building construction to jump 9.5% next year after increasing 7.1% in 2004. "Even acknowledging that vacancy rates will remain relatively high, we still see good opportunities in 2005 and 2006 for the nonresidential building market," says Randy Jiggard, FMIs manager of market information. He sees total nonresidential building construction increasing 5.8% next year, a faster annual growth rate than that predicted for the single-family housing market. Along with office building work, FMI sees a strong rebound in the commercial building market, which reversed three years of declines by increasing 2.9% in 2004. FMI predicts the commercial building market will grow another 7.2% in 2005.
| FMI: Construction Put-in-Place $ millions (current dollars) | |||||
| PERCENT CHG. | |||||
| TYPE OF CONSTRUCTION | 2003 | 2004 | 2005 | 03-04 | 04-05 |
| TOTAL CONSTRUCTION | 898,295 | 974,811 | 1,028,603 | +8.5 | +5.5 |
| Residential | 482,902 | 534,941 | 566,699 | +10.8 | +5.9 |
| Single-Family | 298,258 | 335,452 | 354,412 | +12.5 | +5.7 |
| Multifamily | 50,667 | 52,304 | 54,842 | +3.2 | +4.9 |
| Home Improvement | 133,977 | 147,185 | 157,445 | +9.9 | +7.0 |
| TOTAL NONRESIDENTIAL | 291,363 | 312,485 | 330,542 | +7.3 | +5.8 |
| Lodging | 10,715 | 11,051 | 11,702 | +3.1 | +5.9 |
| Office | 40,349 | 43,218 | 47,332 | +7.1 | +9.5 |
| Amusements and Recreation | 19,030 | 20,140 | 21,356 | +5.8 | +6.0 |
| Religious | 8,363 | 8,595 | 8,930 | +2.8 | +3.9 |
| Education | 71,117 | 71,999 | 73,473 | +1.2 | +2.1 |
| Health care | 29,581 | 30,589 | 31,815 | +3.4 | +4.0 |
| Commercial | 61,034 | 62,778 | 67,305 | +2.9 | +7.2 |
| Manufacturing | 14,076 | 14,598 | 16,433 | +3.7 | +12.6 |
| Public Safety, Administrative | 8,495 | 8,485 | 8,799 | -0.1 | +3.7 |
| Transportation | 24,227 | 25,150 | 26,800 | +3.8 | +6.6 |
| NONBUILDING STRUCTURES | 124,030 | 127,385 | 131,362 | +2.7 | +3.1 |
| Conservation & Development | 3,734 | 3,875 | 4,069 | +3.8 | +5.0 |
| Highways & Streets | 61,877 | 63,795 | 65,697 | +3.1 | +3.0 |
| Sewers Systems | 12,66 | 13,216 | 14,128 | +4.4 | +6.9 |
| Power | 36,230 | 36,592 | 36,958 | +1.0 | +1.0 |
| Water Supply | 9,526 | 9,907 | 10,510 | +4.0 | +6.1 |
| Source: FMI Corp., Raleigh, N.C. Historical data is compiled from building permits, construction-put-in-place, Clark Reports and trade sources. Estimate for 2004 and forecast for 2005 by FMI. | |||||
(Photo top by Monica N. Macezinskas, photo manipulation by Nancy Soulliard for ENR)
|

