'Spare Time' Project Yields Carolinas Power Outage Tracking Map
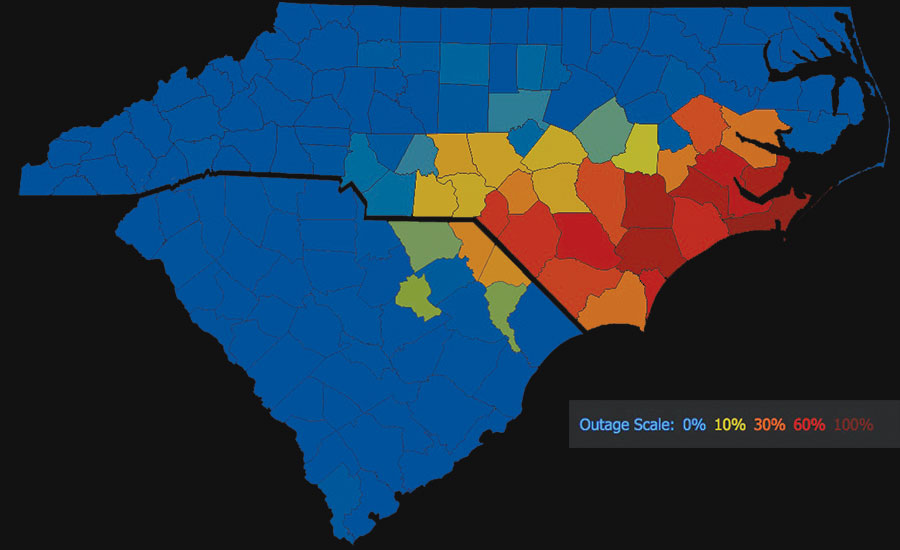
Bots collect utility service data to keep PowerOutage.us status maps updated. ENR combines N.C. and S.C. maps from late afternoon Sept. 17 for this display.
MAP DATA COURTESY OF POWEROUTAGE.US; MAP GRAPHIC BY SCOTT HILLING
PowerOutage.us is a live, online map of power outages by county. It recently provided blow-by-blow visual commentary on the fight between nature and electric utilities during Hurricane Florence’s trek through the Carolinas in September, attracting 12 million views.
County by county, the color-coded maps of North and South Carolina changed from 100%-service blue to warmer hues representing percentages of outage to dark red, in many places, indicating a total loss of power. Then, as utility crews went to work, the map showed the trend reversing back to blue.
The site was created in 2016 as a “personal project” and is maintained in his spare time by Jason Robinson, a database administrator who says he just wanted to learn how to harness cloud computing and Microsoft Azure.
“I’ve always been interested in watching power outage maps for hurricanes,” says Robinson, “but there’s no place to view that information. You have to switch between different pages and you’re still not getting that good of a picture.”
Robinson’s data map draws from 571 utilities and covers most of the U.S. To collect the data and keep his maps updated, he created a power-outage bot that pings the utilities’ publicly available data sources every 10 minutes. Robinson says he also has worked out deals with utilities that don’t provide public data to aggregate their data in other ways.
“I get it all in and I have to do a ton of data error correction from there,” Robinson says, “like even county name spelling errors. Those throw everything off … I usually tell them about those.”
The personal project is growing. PowerOutage.us was swarmed with requests during the storm fight in the Carolinas and is featured in many international news outlets, but Robinson says there is a lot more work to do.
“There are some states I haven’t completed, like Idaho and Montana,” says Robinson. But he adds that he’s working on expanding to include those states. Canada is next and eventually Europe. “Right now, this is all I can handle in my spare time. I still have a full-time job.”
Robinson pays for administration fees by selling outage reports, an API, and a map widget, so websites can embed his maps onto their pages. Those products are available individually for $100 per month. Historical data also is available and priced by the job, says Robinson.