Bridges
Pace of Upgrading Deficient Bridges Slows, ARTBA Report Says

Work continues on many structurally deficient bridges, including Arlington Memorial Bridge linking Virginia with the District of Columbia.
Photo by National Park Service Photo/John Seeger
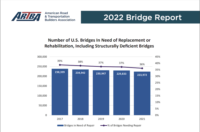
States continue to chip away at the huge backlog of more than 47,000 structurally deficient bridges but the 2018 pace at which the subpar spans are rebuilt and taken off the list was the lowest in five years, a new American Road & Transportation Builders Association report says.
The ARTBA study, released on April 1, also estimates that the cost to bring all deficient bridges to an acceptable level is $171 billion.
ARTBA based its report on the latest update of the Federal Highway Administration (FHWA) National Bridge Inventory, which totals 616,087 bridges.
The association notes that structurally deficient bridges aren’t necessarily unsafe but “are in need of attention.”
It points out that the study’s release comes at a time when Congress and the Trump administration are digging into transportation infrastructure issues. Senate and House transportation committees have held hearings on the topic but no legislation has emerged yet.
A key deadline is Sept. 30, 2020, when the current highway-transit reauthorization statute, the Fixing America’s Surface Transportation Act, is due to expire.
The ARTBA report says that in 2018, there was a net decrease of 567 deficient bridges, or just 1.2%, bringing the total to 47,052.
By comparison, ARTBA said that the roster’s annual net decline for 2014 through 2017 averaged 1,700 bridges.
Alison Premo Black, ARTBA chief economist, said in a statement, “America’s bridge network is outdated, underfunded and in urgent need of modernization.” Black, who did the bridge data analysis, added, “State and local government just haven’t been given the necessary resources to get the job done.”
Congress and the Trump administration have been targeting some funds for bridges. In recently enacted legislation, congressional appropriators set aside $475 million for a “bridge replacement and rehabilitation program.”
In the its fiscal 2020 Dept. of Transportation budget request, the Trump administration included $300 million for a “competitive highway and bridge program.”
But bridges also are eligible for much larger sums of federal funding from their shares of federal-aid formula highway funds, which total $45.3 billion this year.
As of 2018, the ARTBA report said, Rhode Island had the largest percentage of structurally deficient bridges, at 23% of its total inventory; followed by West Virginia, 19.8%; and Iowa, 19.3%.
Iowa had the largest number of deficient bridges, with 4,675; followed by Pennsylvania, with 3,770; and Oklahoma, at 2,540.
Fourteen states have seen an increase in structurally deficient bridges over five years, led by West Virginia, up by 522; Illinois, up by 159; and Florida, up by 109.
On the other hand, Pennsylvania has removed the most bridges from the deficient list over the past five years, with 1,199; Oklahoma has removed 900 and Indiana has removed 593.
ARTBA notes that the FHWA—following a mandate in the 2012 Moving Ahead for Progress in the 21st Century Act (MAP-21)—has changed the definition of structural deficiency.
FHWA now categorizes bridges as deficient if one of their important structural components (deck, superstructure, substructure or culverts) are in poor condition or worse.
The previous definition also counted bridges as deficient if they overall were in poor or worse structural condition or had inadequate waterway openings.
Correction 4/9/2019: First paragraph of earlier version of story misstated total structurally deficient bridge backlog. Correct number is more than 47,000.


