Infrastructure Finance
States' Capital Spending Climbs 8% in Fiscal 2019
Thanks in part to a strong increase in transportation spending, states’ total capital expenditures, including infrastructure funding, rose 7.7% in fiscal year 2019, to an estimated $113.9 billion, a new National Association of State Budget Officers report says.
The capital spending figures are part of NASBO’s annual report on overall state expenditures, released on Nov. 21. (View report summary here.)
The budget officers' group says that the 7.7% annual increase in capital spending is the third-highest percentage gain over the past 20 years.
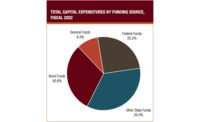
The capital expenditures come from a mix of sources. States' cash resources provided 46% in 2019, bonds accounted for 27.1% and federal funds 26.8%
NASBO says that transportation, the largest capital-expenditures category, climbed by 9.3% in fiscal 2019, to $73.1 billion. The $6.2-billion upturn is the largest in dollar volume among all capital categories.
Transportation’s 2019 capital spending gain follows a 2.8% downturn for that segment in 2018. NASBO points out that capital spending can vary from year to year, because of project delays and the multi-year nature of construction projects. But it notes that transportation capital expenditures have posted an annual average gain of 4.9% since 2010.
NASBO traces the states' 2019 transportation increases to their “efforts at addressing both the maintenance and expansion of [their] transportation systems with tax and revenue actions to raise funds.”
The report also says that since 2013, 33 states have acted to increase fuel-tax revenue.
The report notes that actual transportation capital-type spending could be higher than $73 billion, because a dozen states treat outlays on building and maintaining roads, bridges and transit differently from their other capital spending types.
Overall transpotation capital and operating-budget expenditures were up 8.9% in 2019 to an estimated $171.9 billion, the report shows.
Capital expenditures on higher education—states’ second-largest capital line-item—increased an estimated 2.4%, to $12.1 billion in fiscal 2019.
Capital spending on prisons and other corrections projects climbed 5.7%, to $1.2 billion; housing was up 13.4%, to $1.3 billion.
But environmental capital spending, including drinking-water, wastewater treatment, environmental cleanup and other project types, dipped 5.6%, to $6.4 billion, according to the report.
The “all-other” category—which included such items as parks, behavioral hospitals, community development projects and information technology systems —posted the largest percentage gain, 13.5%, to $17.2 billion.
Among the states, Florida ranks first in total capital expenditures, with an estimated $13.5 billion for 2019. New York is second, at $12.3 billion, the report shows.
Texas ranks third, with $10.9 billion; followed by New Jersey at $6.3 billion; and California at $5.5 billion.
Overall state spending increased 5.7% in 2019, to a estimated $2.1 trillion—exceeding the $2-trillion level for the first time, according to NASBO.
Headline corrected on 11/22/19 to show increase of 8% in capital spending. Percentage increases corrected on 11/25/19 for housing and "all-other" categories of capital spending


