Highway Infrastructure
Report: Small Reductions in Deficient-Bridge Total but Huge Backlog Remains
State and local transportation agencies, with a big assist from federal funds, are continuing to achieve modest progress in trimming the nation’s still-daunting backlog of structurally deficient bridges, according to a new American Road & Transportation Builders Association report.
The ARTBA report, released on April 13, also says that the cost of fixing all 46,154 structurally deficient bridges, plus the additional 81,000 that need to be replaced and more than 103,000 others that need improvements, is a mammoth $164 billion.
ARTBA points out, “While these [structurally deficient] bridges may not be imminently unsafe, they need attention.”
The study, which is based on Federal Highway Administration National Bridge Inventory data, shows that there have been some small improvements, including a net decline of about 900 bridges in 2019, or 1.9%, from the previous year’s total. There was a minuscule 0.1% year-over-year decrease in 2018.
In another encouraging note, structurally deficient bridges’ share of the 617,084 total bridges in the FHWA National Bridge Inventory also edged downward last year, to 7.5%, from 7.6% in 2018.
“Every year, we’ve seen very, very small declines in the overall number of [deficient] bridges,” says Alison Premo Black, ARTBA’s chief economist, who led the study team. “It’s not for lack of trying, but it’s just [that] the pace is quite slow.”
States and localities draw on federal and their own funding resources to tackle bridge projects. But they are grappling with a shifting set of targets. Every year, many bridges are reconstructed or repaired and removed from the deficient category. But every year other bridges’ conditions also worsen, putting them on the deficient list.
In 2019, 6,232 bridges moved off the structurally deficient roster, but 5,332 were placed on the list, leaving a net improvement of 900, according to the report, ARTBA’s sixth-annual bridge snapshot.
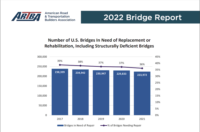
In an interview, Black also noted that the deficient bridges are only one part of a much larger universe of 230,947 U.S. bridges that need replacement or rehabilitation.
That total, too, has been trending downward since 2017. But the magnitude of the need still is great.
Black says, “I think it really underscores that there is a need out there and that these investments could help with some of these issues and hopefully help pick up the pace of making the [bridge] repairs.”
ARTBA calculates that based on FHWA cost estimates and the current rate of funding, it would take more than 50 years to carry out repairs or upgrades on all the bridges that need work.
Targeted programs
States, localities and Congress are well aware of bridge needs and over the years have established programs with targeted funding aimed at chipping away at subpar structures.
For example, in the 2018 appropriations measure for the U.S. Dept. of Transportation, Congress created a new discretionary-grant program for rural bridges. Last August, U.S. DOT selected 20 projects to share $225 million in those grants.
States were required to “bundle” multiple projects into a single contract. Iowa won the largest grant, $33.4 million, to rehabilitate up to 77 bridges rated in poor or fair condition or that had posted weight restrictions.
In 2014, Pennsylvania opted for a public-private partnership to launch its Rapid Bridge Replacement Project, which aimed to replace 558 bridges around the Keystone State. The design and construction cost for the program, which is nearing its end, was $899 million. A team of Plenary Group, Walsh Construction, Granite Construction and HDR was chosen to finance, design, build and maintain the bridges in the program.
In the wake of the coronavirus pandemic, ARTBA and other construction and transportation groups have been urging Congress to include highways, bridges and other types of infrastructure in a stimulus bill.
In recent weeks, President Trump and House Speaker Nancy Pelosi (D-Calif.) raised the idea of having an infrastructure component in economic-recovery legislation. But that seems to be on the back burner. The stimulus and rescue measures enacted so far have focused on direct aid to individuals, small businesses, and hard-hit sectors, such as airlines, transit and Amtrak passenger rail.
Dave Bauer, ARTBA chief executive officer, said transportation construction groups and companies are not requesting federal funds, but feel that transportation infrastructure should be part of the recovery plans.
In particular, Bauer sees a $287-billion, five-year highway measure that the Senate Environment and Public Works Committee approved last July as where the congressional and White House discussions should begin.
State-by-state data
The ARTBA study, the association’s sixth-annual bridge report, also provides state-by-state data.
Iowa had the largest number of deficient bridges in 2019, with 4,575. Pennsylvania ranked second, with 3,501. Illinois was third, with 2,407; Oklahoma ranked fourth, with 2,352. Number five was Missouri, with 2,147.
On the other hand, Pennsylvania has pared its deficient bridge total by 1,200 over the past five years, the most of any state. Oklahoma removed 753 bridges from the category, Indiana 467, Ohio 412 and Virginia 391.
Twelve states saw increases in their deficient-bridge total in the last five years. West Virginia recorded the largest increase, adding 472 to its list.


