As the COVID-19 pandemic recedes in the U.S. and restrictions on work and other interactions are lifted, the construction sector’s rebound is underway, with some markets bouncing back faster than others, analysts say.
“The economic recovery continues to pick up speed as vaccination rates improve and individuals continue to return to a ‘normal’ life,” says Richard Branch, chief economist at Dodge Data & Analytics. “The recovery in the construction sector, however, has been much more modest and uneven by comparison. Rising material prices, labor shortages and logistics issues have created a challenging environment for construction starts as project delays mount.”
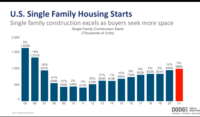
Dodge reports the value of overall construction starts through May is roughly even with that of the first five months of 2020. Residential construction continues to be “the star,” says Branch, up 19% year-to-date. While single-family structure starts remain strong, multi-family housing is on the upswing as well, with projects such as the $500-million Fulton Street mixed-use project in Brooklyn, N.Y., and the $232-million Travis Residential tower in Austin breaking ground in the second quarter of this year.
Related link: ENR 2021 2Q Cost Report PDF
(Subscription Required)
Housing Stays Hot
David Burstein, senior principal of industry consulting firm PSMJ Resources, also noted the housing sector’s strength, as it topped the company’s Quarterly Market Forecast survey of construction markets for the third time in the last four quarters. “This market continues to be red hot, so we see no slowdown in activity for the foreseeable future,” says Burstein.
Non-residential starts for the first five months of 2021 remain weak overall, with a 5% drop from the same time period in 2020, according to Dodge data. The decline, unsurprisingly, was largely felt in the office, hotel and retail markets, while warehouse and manufacturing work saw an increase in activity.
Starts are up 8% in the non-building sector, bolstered by environmental public works and utility-scale renewable projects. While highway and bridge work is down overall, among the largest non-building projects to break ground in the first half of the year was the $795-million West Davis Highway improvement project in Farmington, Utah.
“Looking ahead, hope abounds that construction starts will soon begin a more robust rebound,” says Branch. “The expectation of an infrastructure package being approved by year-end also provides hope that next year will see much stronger and consistent growth patterns.”
Consultant Rider Levett Bucknall reports that construction costs have increased 2.9% in the second quarter, the largest quarterly growth that the firm has recorded in its 20 years of data analysis. “With the rollout of nationwide vaccinations allowing human activity to begin to return to ‘pre-pandemic normal,’ construction cost inflation lost no time in making its presence felt,” says Julian Anderson, president of the firm.
While the quarterly increase is “eye-popping,” Anderson notes the year-over-year figure is more modest, at 4.35%. “The question will be whether the second quarter numbers are simply a catch-up or are actually a harbinger of a new round of price increases,” he says. “My sense is that there is a little of both, and that construction escalation for 2021 will end up in the range of 6% to 7%.”
Lumber Prices Pass Peak
After months of soaring prices, the lumber bubble has begun to pop, says Deni Koenhemsi, economics manager at IHS Markit. “The urgency around demand is dissipating as many divert their spending to outside of home—vacations, eating out [and other] activities they were unable to do during the pandemic,” she says. “Buyers are resisting prices that are still significantly higher than the norm.”
“Hope abounds that construction starts will soon see a more robust rebound.”
—Richard Branch, Chief Economist, Dodge Data & Analytics
The firm’s second quarter forecast predicts a 70.2% overall hike in softwood lumber prices in 2021, up significantly from the 19.2% increase forecast in the first quarter. A 34.8% drop is expected in 2022, as the pandemic recedes. Plywood prices will rise 39.8% this year, says IHS Markit, a boost from the first quarter forecast of 9.6%. That increase will largely dissipate in 2022, however, with a 28.4% drop expected.
Steel prices have been on the rise as well, with the company forecasting a 30.9% hike for reinforcing bars in 2021. Prices for structural shapes will see similar increases, at 31%. “In the U.S., we see price increases due to supply-chain issues and increases in the prices of scrap,” says Christos Rigoutsos, IHS Markit senior economist. “Most mills have low availability and are sold out one to two months ahead. Domestic sellers’ favorable position has yet to deter buyers, and demand is firm. Longer lead times have made imports unattractive as customers are reluctant to lock in orders at such high prices.” Similar to lumber, IHS Markit’s second quarter forecast says 2021’s soaring prices will fall in 2022. Rebar is set to drop 14.4%, with prices for structural shapes down 17.4%.
Looking at Labor
“Labor believes it is emerging from the health crisis with a more powerful voice in setting working conditions and levels of compensation,” says Alex Carrick, ConstructConnect chief economist. “In nearly every sector, with construction near the forefront, much of the talk centers on record high numbers of job openings but extreme difficulty in filling positions with qualified personnel.” The latest Construction Labor Research Council report on union labor costs shows boilermakers lead in compensation at $70.62 per hour, 19% higher than average. Roofers’ wage is 22% lower than average, at $45.95. The Southwest Pacific has the highest wage rate among U.S. regions at $69.45, 76% higher than the lowest region, South Central, at $39.42.
Formula for Creating ENR Indexes
The formula we use to create our two major cost indexes, the ENR Construction Cost Index and the ENR Building Cost Index, has four inputs: Portland cement, structural steel, lumber and labor. Labor is the largest component of each index.
The labor data we use to compute our index is union wage rate data. Union wage rates are typically set by annual contracts. Therefore, the labor rates in our indexes only fluctuate once per year, which is a major factor in why the indexes behave the way they do.
Once each year, in our first quarterly cost report, we publish pie charts that show the proportions of each of the four inputs in the total index.


